

Concerning the preferred isocratic elution of high-performance liquid phase, the simpler the mobile phase ratio, the fewer buffer salts can be used. The simpler the elution method, the more common the hplc column, the better, but sometimes the separation of many impurities cannot be satisfied with a single ratio of mobile phase or a common column. It is necessary to redevelop the chromatographic separation method. The following are some personal experiences in developing analytical conditions, hoping to give some experimental inspiration to newcomers.
1, to determine the nature of the target compound, first need to understand some of the properties of the impurities to be separated, such as molecular weight, structural formula (mainly depends on which group), and the substance in which organic solvent is easy to tolerate. The structural formula is very important for predicting the polarity size of the molecule and determining whether the substance is easily hydrolyzed. For example, -, -NHR, -, -COOH, -0H, etc., are the common polar groups, while the common benzene ring, -CH=, –, etc., are the common non-polar groups. Based on experience, we can roughly judge the polarity of the substance, predict whether it is retained on the commonly used hplc column, and then combine the solubility of impurities in various common elution solvents, such as which is more soluble in methanol, acetonitrile, hexane, and select the organic mobile phase suitable for elution, to determine whether the method is developed with a normal phase column or a reverse column to make a rough judgment.
2, determine the forward and reverse phase elution mode to determine the elution mode, reverse then personally recommend first with 60% acetonitrile or methanol, first to see if you need to separate several substances can be separated, (the normal phase elution mode similar ideas). In the premise of being able to separate and then look at the peak time of the last peak, if the time is longer, and then according to the separation of the first few peaks, determine whether you need to increase or reduce the proportion of organic phase. Our common elution separation method is reversed-phase separation, and the reversed-phase elution method is divided into two systems, one is a methanol-water system, and the other is an acetonitrile-water system. The specific choice of which reversed-phase elution system needs to be decided according to the following conditions.
A. The elution capacity of acetonitrile is better than that of methanol, and the target peak of the acetonitrile-water system is faster than that of the methanol-water system under the same concentration and sample.
B, methanol dissolved in water will emit heat, acetonitrile dissolved in water will absorb heat, in the same way of gradient elution, in the two mobile phases mixed due to molecular thermal motion, methanol dissolved in water than acetonitrile dissolved in water molecular thermal motion, so that the mixing of the two mobile phases will be more uniform, reflected in the baseline performance of the baseline is smoother, and fewer gradient peaks.
C. Methanol is sold at a lower price than acetonitrile in the market (if the company has a lot of money, it can ignore this article).
D. The molecular weight of methanol is larger than that of acetonitrile, and the column pressure of the acetonitrile-water system is smaller under the same column and the same concentration of organic phase.
E, the cut-off absorption wavelength of methanol is near 210nm, while the cut-off absorption wavelength of acetonitrile is near 190nm. When the detection wavelength is far from 210nm, the choice of methanol or acetonitrile-water system mainly depends on other influencing factors. However, when the measurement wavelength is near 210 nm, because the cut-off absorption wavelength of methanol is larger than that of acetonitrile, except for the difference of mobile phase, the response value of the sample measured by acetonitrile-water system is higher under the same measurement conditions, so that a smaller sample detection limit can be obtained. It recommended that the acetonitrile-water system is preferred.
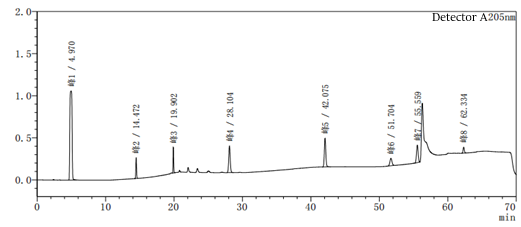
Figure 2-1 System suitability profile with methanol-water as the system
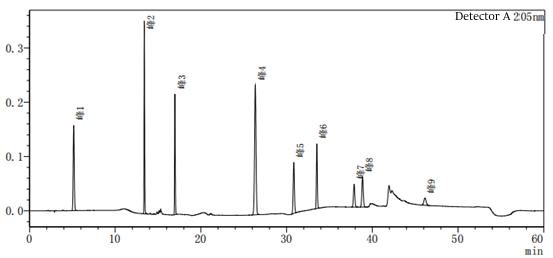
Figure 2-2 to acetonitrile-water for the system of the system suitability of the above two diagrams in Figure 2-2 than Figure 2-1 to add one more impurity, that is, the peak 5 in Figure 2, the rest of the impurity species unchanged, the peak position unchanged, the above two diagrams mainly look at the baseline of the spectrum and the peak position of each impurity.
3, determine the column, flow rate, and column temperature laboratory analysis is most commonly used is the type of column, generally 5μm 4.6×250mm or 4.6×150mm, in the early test if, in the absence of reference material, the most common 5μm 4.6×250mm hplc column is preferred to try; if found with 5μm 4.6×250mm chromatography If it is found that when the 5μm 4.6×250mm column is used to separate a variety of impurities, there is a bifurcation peak or theoretical tower plate number is relatively low, it suggests that this type of column is not good for the separation of the substance, we need to replace the column with a higher column efficiency, usually choose the particle size, packing smaller column, this needs to be determined according to the current situation, after testing the column suitable for detection. And the choice of flow rate is usually based on the specific type of column, and the highest withstand pressure to decide and the commonly used column general flow rate of 1.0mL/min. The flow rate of impurities separation is a relatively small impact. The higher the column temperature is, the faster the peak of various substances will be, and the smaller the column pressure will be, but the higher the temperature will lead to the packing in the column will be easily washed down by the mobile phase, which will lead to the irreversible decrease of the column efficiency. Therefore, the column temperature should not be too high, and the general temperature should be set at 25 ~ 35 ℃. Of course, some special varieties need a column temperature of 40 ℃ or even higher.
4, the gradient elution program selection in a good choice of positive and reverse phase elution determines the column, column temperature, and flow rate. No matter how to adjust, the gradient and mobile phase ratio can not be separated from the two impurities. It would help if you used the gradient elution mode. Gradient elution is a method in which different organic ratios of mobile phases are added at different times. Compared with the traditional isocratic elution method, it has the following advantages.
A can increase the separation of the two substances through different periods to join the organic phase concentration so that impurities in different periods by the organic phase elution concentration are different. The general principle is to gradually increase the proportion of the organic phase so that the impurities are difficult to elute out of the peak faster.
B. Since the concentration of the organic phase added can be adjusted, compared with equal degree elution, the analysis time can be shortened, and several substances that cannot be separated by equal degree elution can be separated at one time so that a variety of substances can be analyzed by one analysis method and the cost can be reduced. Gradient elution procedure of the mapping process, the following principles need to be followed: principle one: do not use a single mobile phase primary experimenter gradient elution, mobile phase A is generally buffer salts, and mobile phase B is generally pure organic phase. But senior experimentalists who use the A phase often do not simply use buffer salts but add a certain percentage of the organic phase for two reasons. The first is that adding at least 5% methanol or acetonitrile can prevent the mobile phase from growing bacteria and reduce the frequent filtration of the mobile phase during this operation. The second is that adding a certain percentage of organic phase can reduce the baseline fluctuations caused by mixing mobile phases A and B with each other in the instrument, making the baseline smoother as to whether the mobile phase B is the choice of pure organic phase or a certain percentage of organic phase such as (80%, 90% of methanol or acetonitrile) to choose according to the experiment. I recommend using a certain percentage of the organic phase as the mobile phase B. Because when adding pure acetonitrile or methanol and other organic phases, there will be great baseline fluctuations due to heat absorption or exothermic reactions in mixing the two phases, using a certain percentage of organic phase as the B phase can effectively reduce the mobile phase impact effect. Principle two: the organic phase to join the gradient as slowly as possible the following is an experimental project of the author’s own, in the gradient method of figuring out a case, directly on the figure.
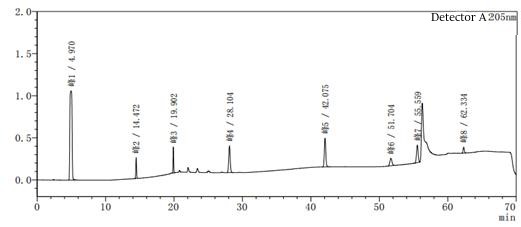
Figure 4-1 Gradient 25 mapping Gradient method 25 elution procedure
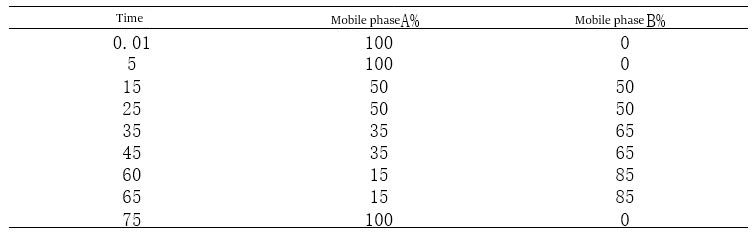
Figure 4-2 Gradient 26 mapping gradient method 26 elution procedure
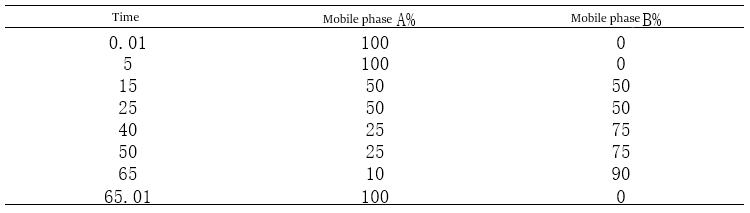
Figure 4-3 Gradient 27 atlas
Gradient method 27 elution method
Comparing the above plots and gradient elution procedures shows that the slow addition of the organic phase can make the gradient peaks smoother and make the separation of each impurity peak better.
Regarding the appearance of gradient ghost peaks, if the pure buffered salt phase and the organic solvent phase are mixed, there will be a great mutual solubility impact effect at this time, even if the more commonly used ghost peak trap small column on the market is installed, the baseline is still not very smooth; so I recommend using a certain proportion of the organic phase mixed with the salt phase as the mixed salt phase, and the mixture of the organic phase mixed with a certain proportion of water as the gradient elution Organic phase, with the use of ghost peak trap small column can make the baseline smoother.
5, the choice of buffer salts. First, to understand why we need to add buffer salts, one of the roles of buffer salts is to increase the buffering capacity of the mobile phase. What is the role of common inorganic buffer salts (potassium dihydrogen phosphate, dipotassium hydrogen phosphate, ammonium dihydrogen phosphate, ammonium acetate, etc.) in adjusting the buffering capacity of the mobile phase; what is the buffering capacity? The smaller the pH change of the mobile phase, the stronger the buffering capacity of the mobile phase and the weaker the opposite. In some standards, two kinds of buffer salts are used in configuring the same mobile phase. This is because using a compound salt as the mobile phase has a stronger buffering capacity than using a single salt as the mobile phase. Some of the main components to be measured are easily hydrolyzed in neutral or basic environments, for example, groups with -OH, which are easily hydrolyzed in neutral and basic environments and appear as double-headed peaks on the spectrum. To prevent this type of hydrolysis, phosphate can be added to adjust the pH to an acidic environment with phosphoric acid, thus inhibiting hydrolysis. The other function of adding buffer salts is to increase the retention time of the components to be measured. Usually, when substances with amino groups or ammonia groups such as -, -NHR, -, etc., are added to increase the retention of the substance, ion-pairing reagents such as sodium methanesulfonate and sodium octane sulfonate can be added – (sulfate group) to enhance retention. Generally speaking, the buffer salt is not out of the peak. I have used pH 3.0 water as the mobile phase with potassium dihydrogen phosphate as a buffer salt pH 3.0 aqueous solution as the mobile phase. The gradient peaks from the two spectra match very well, so colleagues do not have to worry about the buffer salt will cause gradient peaks. The direct cause of the gradient peak is the mobile phase mixing shock.
6, the choice of detection wavelength on the choice of detection wavelength, you need to combine several impurities of the UV absorption spectrum for comprehensive consideration, the best choice of UV absorption characteristics of the spectrum at the wavelength of the peak as the detection wavelength, but also to take into account whether other impurities in the wavelength of UV absorption.
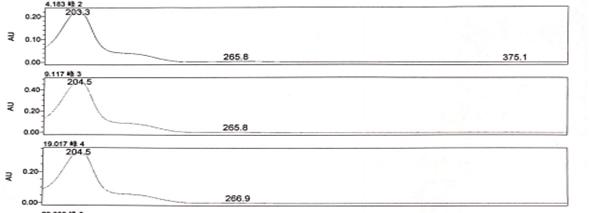
Figure 6-1 UV absorption characteristics of impurities in the above graph, for example, shows that the maximum absorption of the three impurities is 203.3, 204.5, 204.5nm, while in the range of 205 ~ 230nm can also be used as a secondary wavelength. Therefore, the detection wavelength of the three impurities can be tentatively set at 205 nm. Wavelength selection points to note: 190 ~ 210 nm. This range of wavelengths is carefully selected. The band’s wavelength belongs to the low band, subject to more interference, especially by the purity of the reagents in the mobile phase has a greater impact. Suppose you encounter impure reagents or poor water quality. In that case, there will be a similar gradient peak “peak” such peaks are often smooth and not as sharp as the peak of the real impurities, and at the same time, no matter how to adjust the gradient elution program, always a specific location “peak. ” If the “peak” affects the impurities out of the peak, then it is very difficult to eliminate. I once encountered a project that was this peak entangled for a long time. Then through the replacement of higher-level reagents, purer water, multiple flushing of the instrument and the column, and gradually to exclude the problem, I experimented with the DAD detector, selected 265nm, 225nm, and 205nm as the detection wavelength, the “peak ” in 265nm, 225nm will not appear, so 205 this wavelength carefully selected.
7, the choice of solvent, if the elution with equal degrees, preferred to use the mobile phase as a solvent, generally directly with the mobile phase as a diluent, is sufficient to meet the daily analysis requirements. But for the gradient elution mode, choosing a solution with a similar concentration to the initial gradient as the solvent is best. Still, the following points must be considered: isocratic or gradient elution.
The first is the solubility of the solvent to the sample. If the selected solvent has insufficient solubility in the sample, the light will not produce peaks, and the heavy will block the instrument and lc column.
The second is the need to consider whether the solvent peak will impact the separation of the target peak. If the solvent peak affects the target peak, the selected solvent is unsuitable. For the selection of gradient elution solvent, the appropriate solvent can be selected by gradually adjusting the ratio of organic phase to salt phase in the solvent and observing the spectrum while paying attention to the pH and buffering capacity of the solvent to be comparable to the mobile phase as much as possible.
What the hell is the solvent peak we have been talking about? The solvent peak is due to the difference between the organic phase in the solvent and the initial mobile phase, and the “peak” is caused by the different polarity of the two in the sample and the different absorbance at the same wavelength, which can be masked by changing the measurement wavelength. Of course, in the actual development of analytical methods, many people feel that the choice of solvent is not so important and often ignore the importance of the solvent. The following is a project I did due to the wrong choice of solvent, which caused a tragic case.
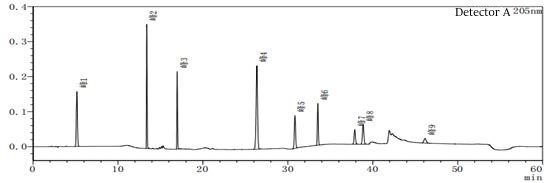
Figure 7-1 System suitability profile in peak 4 out of the peak position out of a solvent peak often appears, resulting in a great impact on the results when doing the limit of quantification and limit of detection. The blank solvent profile is after injecting different mobile phase A and mobile phase B as solvents.
Figure 7-2 Solvent profile of mobile phase A:B=100:0
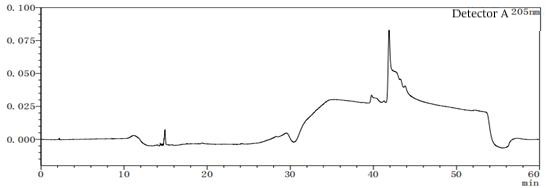
Figure 7-3 Solvent profile of mobile phase A:B=95:5
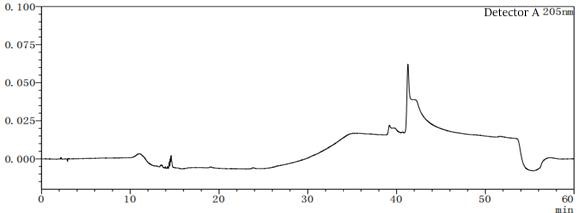
Figure 7-4 Solvent profile of mobile phase A:B=90:10
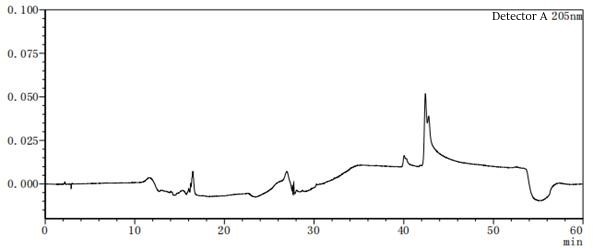
Figure 7-5 Solvent profile of mobile phase A:B=85:15
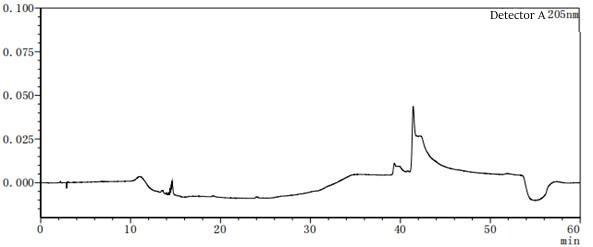
Figure 7-6 Solvent profile of mobile phase A: B=80:20 From the above profile, it can be seen that there are differences in the solvent gradient peaks between different ratios of mobile phases A and B. In the pre-test, try several different concentrations or types of solvents as much as possible to consider which solvent should be the final.

Post time: Mar-03-2023


