

In reversed-phase chromatography, increasing the column temperature usually decreases the retention of the analyte. In a method where column temperature is not controlled, what can go wrong if the temperature of the experimental environment changes?

In early liquid chromatography, precise column temperature control was not a primary consideration in many instrument setups. Unlike gas chromatography, where column temperature is the most important experimental variable in determining retention, in liquid chromatography, the effect of column temperature on retention is much weaker relative to the composition of the mobile phase (i.e., the ratio of organic to aqueous phases in reversed-phase, hydrophilic chromatography HILIC, or the ratio of anion to cation concentrations in charge-based separation methods is much more important for analyte retention).
As the understanding of the effect of temperature in liquid chromatography is increasing, for example, further understanding of the effect of column temperature on the retention of different types of analytes (1), the importance of matching the mobile phase temperature at the column inlet to the column temperature (2), and the effect of heat flow in the column on column efficiency (3), the need for precise control of liquid chromatography column temperature is also increasing. More and more chromatographers have begun to pay attention to controlling the temperature of liquid chromatographs (and instrument manufacturers have long designed appropriate instrument modules). They are used to specify a temperature value or temperature range when developing and validating methods. However, many methods still specify “room temperature” conditions, and most of the time, the “room temperature” referred to in the method is not clearly defined. This raises the obvious question: Can we reasonably expect the same separation in Anchorage, Alaska, as in Mumbai, India, with a method like this?
In this issue of “Liquid Chromatography FAQ,” we will discuss the rationale for the effect of temperature on compound retention in liquid chromatography and use some experimental data to help us understand under what conditions the separation of compounds would be severely affected if some variation in “room temperature” conditions were allowed to occur. The separation of compounds can be seriously affected if some changes in “room temperature” conditions are allowed.
Principle of the effect of column temperature on compound retention in reversed-phase liquid chromatography
In reversed-phase liquid chromatography, the effect of column temperature on compound retention can be described by Van’t Hoff’s law, as listed in Equation 1 below:
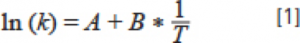
k is the retention factor of the analyte, and T is the temperature at this k value. Variable A is a condition-specific parameter related to the transfer of entropy between and compared to the analyte from the mobile phase to the stationary phase (the relationship between the stationary phase volume and the mobile phase volume), while variable B is related to the transfer of enthalpy between the analyte from the mobile phase to the stationary phase. Figure 1 shows the retention data for several neutral small molecule compounds at different temperatures on a C18 column with acetonitrile water as the mobile phase. The data follow a roughly linear trend, as predicted by equation 1. Weber’s team verified this with a large amount of experimental data, concluding that the nonlinear version of equation 1 fits the experimental data better than the linear version (1). Other researchers have disputed that the appearance of linearity in the data tends to be more of a coincidence than a thermodynamic necessity.
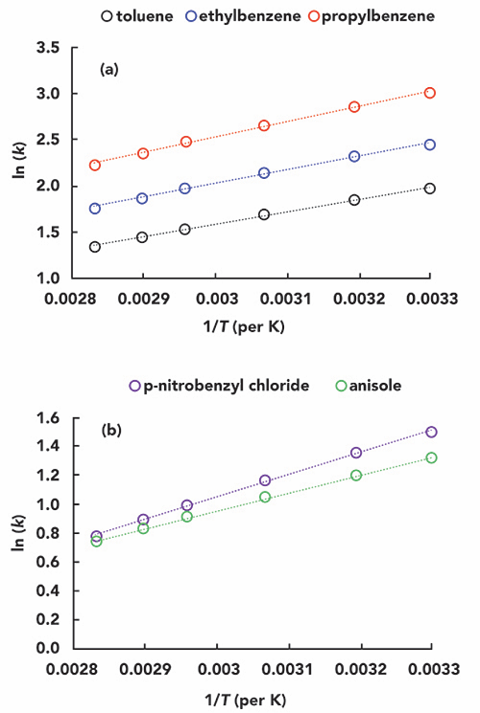
Figure 1. Effect of variation of column temperature (T) on retention factor (k) for several neutral small molecule compounds on a C18 column with acetonitrile-water (50/50) as mobile phase: (a) for toluene, ethylbenzene, and propylbenzene; (b) for p-nitrobenzyl chloride and anisole. The dashed line is the linear regression line. Data are from Yun Mao’s Ph.D. thesis (6).
The slope of each line in Figure 1 is related to the enthalpy transfer of the analyte from the mobile phase to the stationary phase. For molecules with similar chemical structures, the values of these slopes are similar, as shown in the data for toluene, ethylbenzene, and propylbenzene in Figure 1a. For the separation of these structurally similar compounds, increasing the column temperature reduces the retention of the analyte without much change in the spacing (i.e., selectivity) between the peaks since all peaks are moving in one direction at about the same rate. However, the slopes can vary considerably for some compounds with different functional groups, such as p-nitrobenzyl chloride and anisole, in Figure 1b. In such examples, increasing the column temperature will reduce the retention of the analyte, but the selectivity and separation will change because of the different rates of change. Extreme examples show that it can even lead to a change in elution order (5). You can try the simulation setup provided at the following website if interested. You can change the mobile phase composition and column temperature and observe the effect on retention and separation.
Let’s look at some experimental data.
In preparation for this “Liquid Chromatography FAQ” issue, I created a microenvironment for a liquid chromatograph in our lab. First, I disconnected the column temperature chamber commonly used for chromatography columns. I warmed or cooled the microenvironment to simulate the effect of “room temperature” changes on the separation and used a small thermocouple to measure the environment’s temperature near the column inlet. Finally, I recorded chromatograms of several simple compounds (acidic, basic, and neutral compounds) at different “room temperature” conditions. The system was equilibrated for 30 minutes at each temperature. Figure 2 shows the chromatograms at 24, 28, and 42 °C for the three “room temperature” conditions. The vertical dashed line is added as a visual aid to help observe the change in retention as the temperature increases.
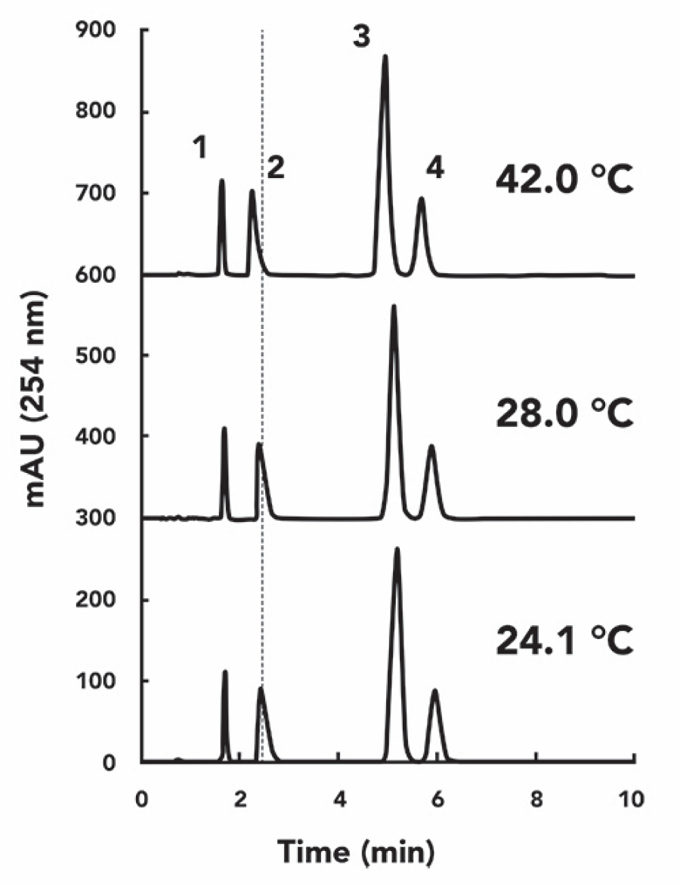
Figure 2: Chromatograms of the test substance at different temperatures. Vertical dashed lines were added as a visual aid to help compare retention times.
Conditions: HPLC column 50 mm x 4.6-mm i.d., Zorbax SB-C18 (5-µm); flow rate 1.0 ml/min; mobile phase, acetonitrile: aqueous ammonium formate (25 mM ammonium/ammonia, 105 mM formic acid/formate, pH 3.2) 40:60 (v/v), injection volume 2 μL. Test compounds 1) acetophenone, 2) nortriptyline, (3) phenylbutazone, (4) butyl benzoic acid
Although these changes are visible to the naked eye, plotting the data results as a function of temperature provides a more accurate understanding of this effect, especially the change in selectivity. Figure 3 clearly shows the effect of temperature on the retention of these four target compounds. In Figure 3a, I plot the absolute values of the retention factors at each temperature. In Figure 3b, I plot the percentage change in the ratio of the retention factor to the average retention factor for each compound over the range of temperatures measured. As expected, the retention of all compounds decreases as the temperature increases, which is the first point we made from this experiment. A change in “room temperature” can certainly cause a change of about 2% in the retention of small molecules. The data at 42 °C is admittedly a bit extreme and even outside the room temperature range for US labs, but it is necessary for liquid chromatography labs worldwide.
In Figure 3b, we find that the trend in the slope of the curve (percentage change in k-value versus temperature T) is essentially the same except for the steeper slope of the nortriptyline curve. As previously discussed, if the retention of all compounds changes equally at the same rate with temperature change, the temperature setting, in this case, would not pose much of a problem for the execution of the method, as it would not have much effect on the separation. However, the rate of change of nortriptyline retention in Figure 3b is approximately two times higher than that of the other compounds.
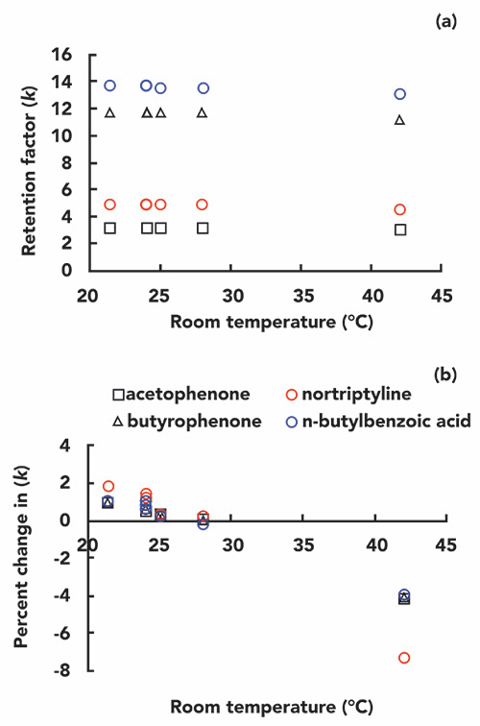
Figure 3: Variation of retention factor (a) and percentage retention factor (b) for the compound to be tested over the test temperature range (21-42 °C)
By plotting the variation curves of the selection factors versus temperature, we can see these changes in relative retention more accurately. Figure 4a shows the selection factor α values for several pairs of target compounds at different temperatures, and Figure 4b shows the percentage change of selection factor α values versus temperature. We found that the selectivity of the neutral compounds (acetophenone and phenylbutazone) did not change significantly when the temperature was increased from 24 °C to 42 °C. Even the selectivity of phenylbutazone and butyl benzoic acid did not change significantly, although their chemical properties are very different. Even though butyl benzoic acid is ionizable, most are still neutral at pH 3.2. On the other hand, we found a very large variation in the selectivity factor of nortriptyline over the temperature range studied. The ratio of the α-selection factor of nortriptyline to phenylbutazone (red circles) or butyl benzoic acid (blue circles) varied close to 5%
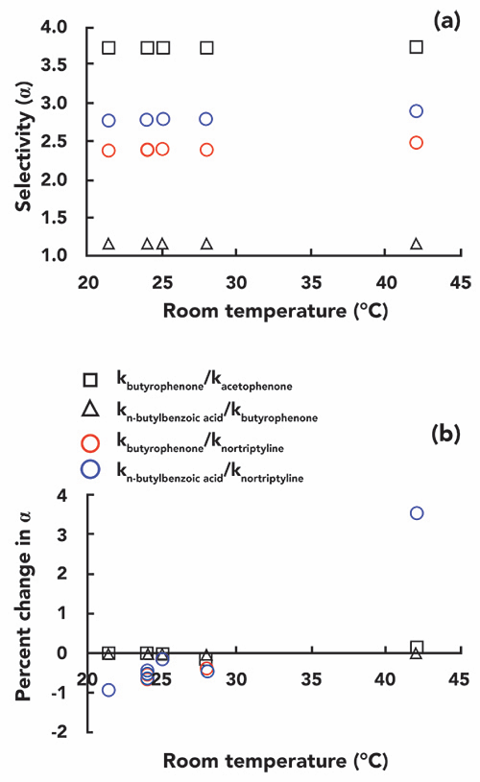
Figure 4: Variation of selection factor (a) and percentage of selection factor (b) for the compound to be tested in the test room temperature range (21-42 °C)
Possible impact on method development and execution
So far, we have observed that temperature variations may have a significant effect on the selectivity of some, but not all, types of compounds on reversed-phase chromatographic separations. The important question in practical applications is: under what circumstances do these changes become important? Several of the compounds I studied separated so well (Figure 2) that even a 5% change in selectivity would not cause them to fail to achieve baseline separation. However, this is not always the case when encountered in practical applications. For example, two adjacent peaks that barely achieve separation at one room temperature condition may have a significant impact on the separation of these two peaks when switched to another room temperature condition. We can quantify this effect by using the Purnell equation (Equation 2).
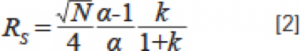
We assume a column efficiency (N) of 15,000, a retention factor (k) of 5 for the two peaks where the latter peak emerges, and a selection factor α of 1.1, which gives a separation (Rs) between the two peaks of approximately 2.3. We can calculate the effect of a change in the selection factor on the separation by using equation 2. In Figure 5, it is shown how the separation decreases when the value of α is reduced by 5% (from 1.1 to 1.045). A separation of 2.3 means that the two peaks are well separated and achieve baseline separation, however, a separation of 1.1 means that there is a partial overlap between the two peaks. Overlapping peaks can then seriously affect the accurate quantification of the method, especially when one of the two substances is at a much higher concentration than the other.
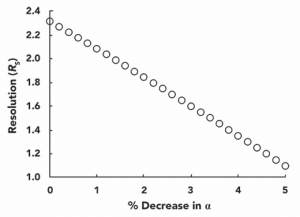
Figure 5: Effect of the decrease in selectivity α on separating two adjacent peaks. The separation was calculated by the Purnell equation (equation 2) assuming N=15000, k=5, and initial α=1.1
Conclusion
In this “Liquid Chromatography FAQ” issue, we have verified the effect of room temperature variation on the performance of reversed-phase liquid chromatography without controlling the column temperature. In the vast majority of cases, it was shown that increasing the temperature weakened the retention of the reversed-phase chromatography. As long as the temperature change has a similar effect on the retention change of both adjacent peaks, it will not affect the separation of these two peaks. However, this is not representative of all cases, and sometimes a significant change of about a few percent in the selectivity of the separation occurs. And these changes in selectivity can, in turn, lead to significant decreases (or increases) in the separation between adjacent peaks, and these changes in separation can reach approximately 50%!
In summary, this means that:
Specifying the “room temperature” conditions during method development will help avoid problems during method implementation, especially when the method needs to be implemented in laboratories with different environments and room temperatures.
During method development, the sensitivity of column temperature changes to method effects must be included in the examination of method stability.
Using a thermostat to control the column temperature can avoid all of these problems, albeit at the cost of an additional instrument module.
May 01, 2020
By Dwight R. Stoll
LCGC North America Volume 38, Issue 5, pg 261–268
Bibliography
- A.R. Horner, R.E. Wilson, S.R. Groskreutz, B.E. Murray, and S.G. Weber, J. Chromatogr A 1589, 73–82 (2019). https://doi.org/10.1016/j.chroma.2018.12.055.
- J.D. Thompson, J.S. Brown, and P.W. Carr, Anal. Chem.73, 3340–3347(2001). https://doi.org/10.1021/ac010091y.
- F. Gritti, LCGC North Am.36(6s), 18–23 (2018).
- F. Gritti and G. Guiochon, Anal. Chem.78, 4642–4653(2006). https://doi.org/10.1021/ac0602017.
- Y. Mao and P.W. Carr, Anal. Chem. 72, 110–118(2000). https://doi.org/10.1021/ac990638x.
- Y. Mao, Selectivity Optimization in Liquid Chromatography Using the Thermally Tuned Tandem Column (T3C) Concept, Ph.D. Dissertation, University of Minnesota, 2001.


Post time: Feb-25-2023


